Quick answer
To calculate standard deviation, first classify the problem, preserve the meaning of every transformation, and verify the final result in the original statement. For the worked example s = sqrt(sum((xi - xbar)^2)/(n - 1)), the result is s ≈ 2.14. The method below shows why that result follows rather than presenting it as an unexplained calculator output.
Identify the problem before calculating
Standard deviation measures spread in the original units. Choose the population formula when the data are the complete population and the sample formula when estimating population variability from a sample. This classification step matters because a familiar-looking expression can require a different rule when its structure changes. Write down any domain restriction, unit, dimension, or reference value before manipulating the symbols.
State whether the data are a population or sample and preserve enough precision through intermediate calculations. The reported number should be interpreted with the distribution, not in isolation.
Step-by-step method
- Compute the arithmetic mean.
- Subtract the mean from every observation.
- Square each deviation and add the squares.
- Divide by n for a population or n - 1 for a sample.
- Take the nonnegative square root of the variance.
Each line should answer two questions: what operation was performed, and why that operation preserves or correctly changes the mathematical object. When a calculator or browser tool is used, keep the original input visible so the output can be compared with the source problem.
Worked example
- For the sample 2, 4, 4, 4, 5, 5, 7, 9, the mean is 5.
- Squared deviations sum to 32.
- Divide by n - 1 = 7 to get sample variance 32/7.
- The sample standard deviation is sqrt(32/7) ≈ 2.14.
The result s ≈ 2.14 is not accepted solely because it looks plausible. The example retains the intermediate quantities that make a sign, denominator, exponent, dimension, or rounding mistake visible.
Read the visual explanation
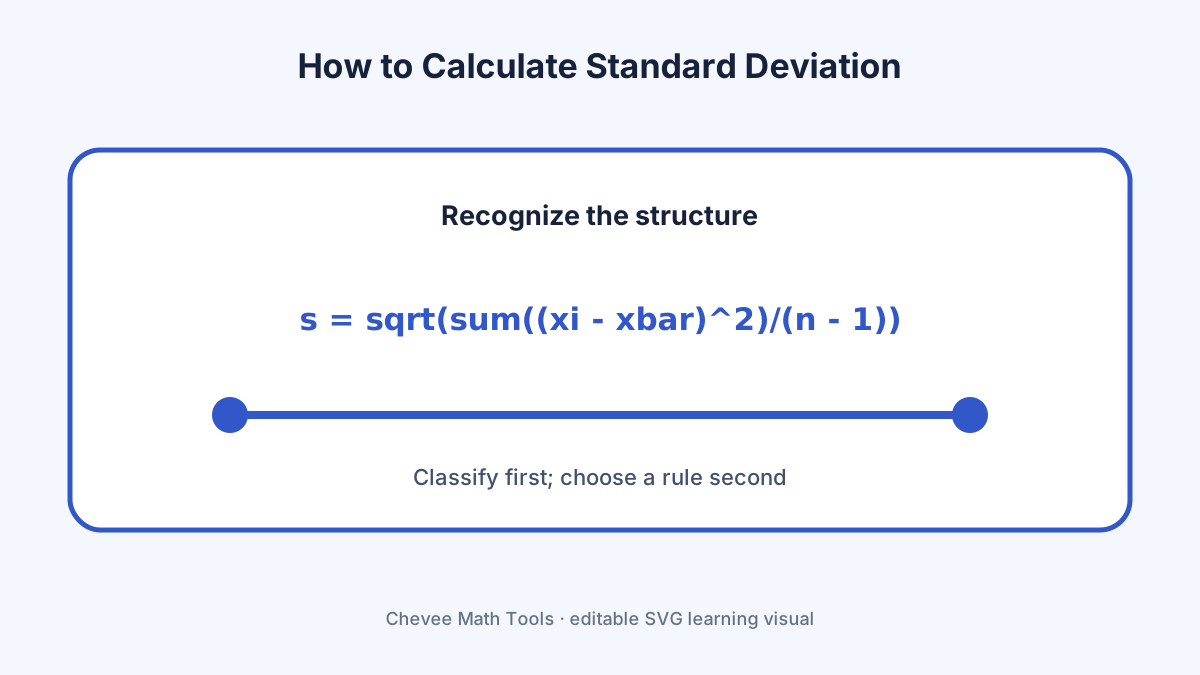
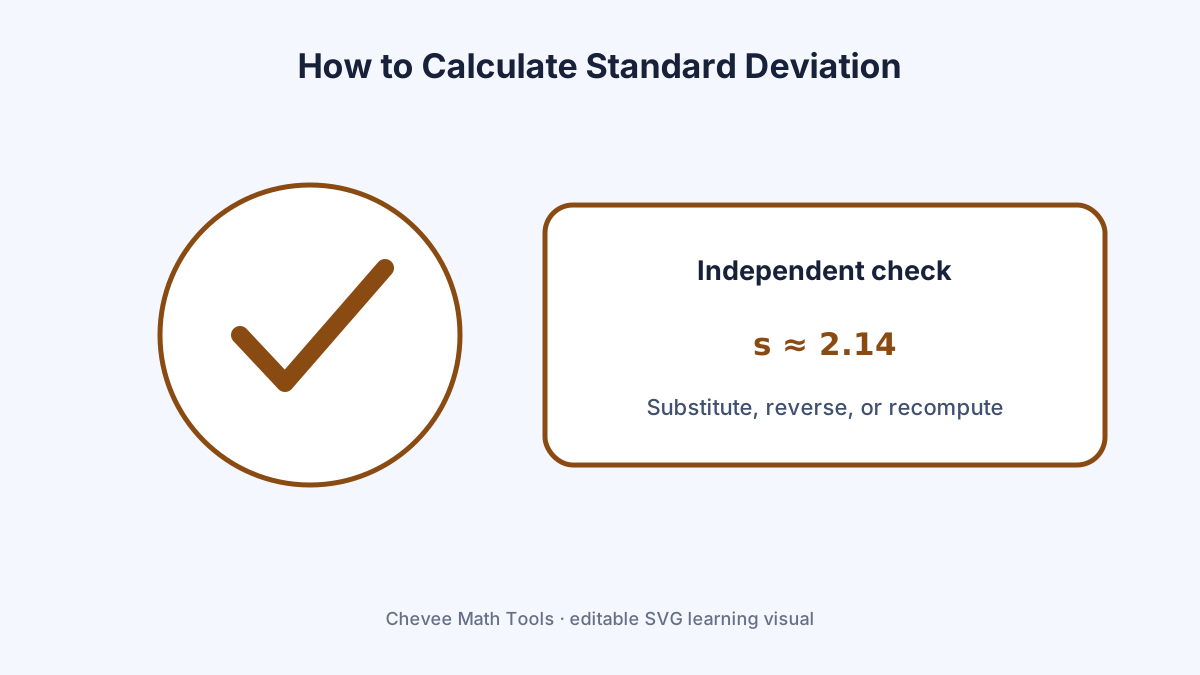
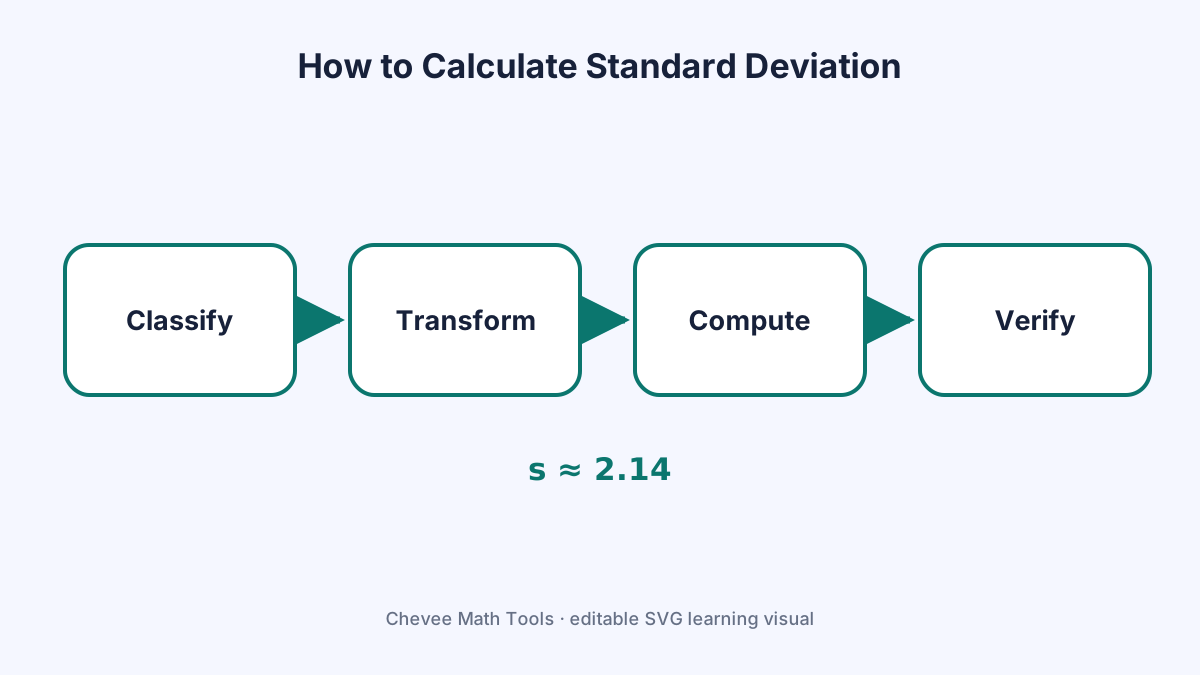
The three diagrams on this page separate the concept, the execution sequence, and the final check. Use the concept diagram to recognize the structure, the workflow diagram while solving, and the verification diagram after obtaining a candidate result. The diagrams are SVG files, so text remains selectable and the graphics stay sharp on mobile screens and when printed.
Common mistakes
- Using n when the task requires sample standard deviation.
- Averaging absolute deviations instead of squared deviations.
- Rounding the mean too early.
A reliable correction strategy is to return to the earliest line where the mathematical object changed. Repeating only the final arithmetic often reproduces the same hidden setup error.
Verify the result
Square the reported standard deviation and compare it with the calculated variance. Also inspect whether the answer has the correct sign, scale, units, dimension, and domain. For an equation, substitution is decisive. For an inverse pair such as differentiation and integration, apply the inverse operation. For a statistical or financial result, recompute one intermediate quantity and compare it with an independent method.
Use the tool without losing the reasoning
Open the matching browser tool with the worked input when available. The tool is useful for recomputation and output formatting, but the page's decision rule remains necessary: unsupported expressions, ambiguous units, and incorrect assumptions can produce a neat result that answers a different question.
Keep a compact record containing the original problem, the selected method, intermediate values, the final result, and the verification. That record is more useful for study, teaching, and debugging than an isolated answer.
Visual explanation
How this guide was checked
Review method: Problem classification review, independent recomputation, reverse-operation or substitution check, source comparison, and visual accessibility review
Verified against: OpenStax instructional references and the page-specific mathematical sources listed below
What changed: Removed repeated sitewide boilerplate and added content-type-specific decision, verification, and applicability guidance for this exact task.
Page purpose: how to calculate standard deviation — Learn a reliable method, follow a worked example, and verify the result
Automated quality check: Passed critical indexing checks.
Verification references
These primary standards and official documentation pages were used to check character identity, syntax, or platform behavior described above.
- Introductory Statistics 2eOpenStax, Rice University — Reviewed probability and statistics definitions, notation, and formulas.
- Digital Library of Mathematical FunctionsNational Institute of Standards and Technology — Definitions, notation, identities, and reference material for mathematical functions.